Insights
Jamie Oliver Cut His Video Output Nearly in Half: What All 2,876 Videos Reveal
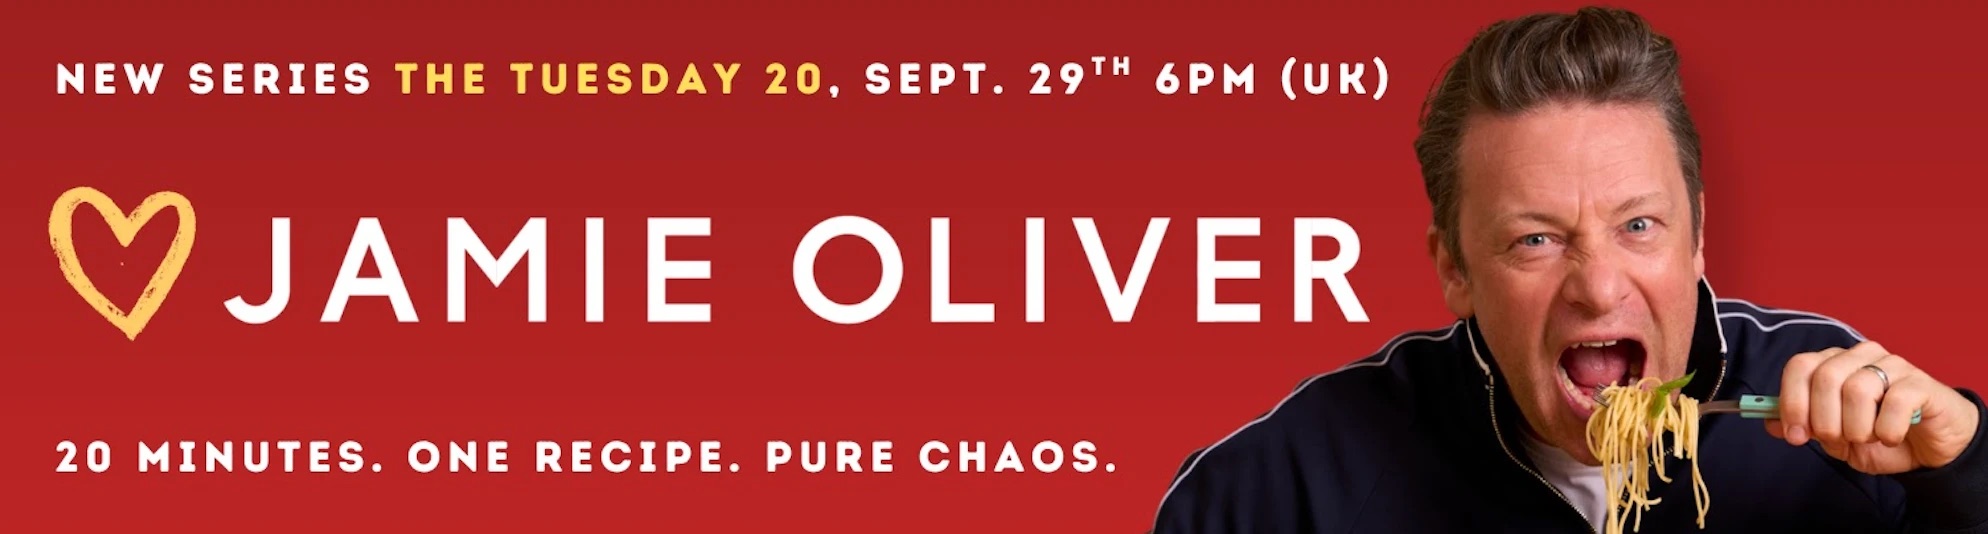
Jamie Oliver published 48% fewer long videos this summer than last, and his channel still kept 86% of its daily views. Half of everything it earns each day comes from videos more than a year old. What's missing is a working link between any of that and the book his channel page is trying to sell.
Jamie Oliver has 6.21 million subscribers and 2,876 public videos, pulled from the YouTube API on 15 September 2026 and re-checked on 17 September. 2,268 of those videos are long-form, 466 are Shorts, and the rest are pre-Shorts clips and livestreams, held out of every figure below because they're a different kind of video with a different typical audience.
The channel doesn't lean on a "celebrity chef" label anywhere in its own description. It sells recipes and food inspiration from a named person, and that's held up for seventeen years and five changes of direction. The analysis below covers where its views actually come from today, what changed to get it there, and the one part of it that's easy to fix and currently isn't tracked at all.
The analysis in this article comes from the same process Stewart runs on client channels every month inside Channel Intelligence.
What he got right
There are six findings. The rest of the article gives you the data behind each one.
- Cutting his output nearly in half barely dented his views. This summer he published 48% fewer long videos than last summer, and his channel kept 86% of its daily views.
- Most of what the channel earns each day isn't from anything new. In a two-day count, half of the views it gained went to videos more than a year old.
- The year before, tripling his output added far more than halving it back cost him. His long-form output nearly tripled in 2025, and his daily views peaked 62% above the year before. This year's cutback cost him 14%.
- His channel is built well, and the one thing it can't do is tell him which video sold his book. None of his last 254 long videos names the book his channel page is trying to sell, and 241 of them link to an untracked homepage instead.
- It's changed direction six times in seventeen years, and it kept working through every one. From short TV clips to a network of guest cooks to long recipe compilations, each shift left the channel bigger than before.
- A short title promising a number of recipes has beaten his typical video since 2013. It's one of the few things that's worked in every era of the channel.
The Takeout: These are the patterns in Jamie Oliver's library, at his size and in his subject, so treat each one as something to test on your own channel rather than a rule to copy. Pick one, check it against your own videos, and keep it only if your numbers agree.
1. Output fell by half, views fell by a sixth
Comparing the same eleven weeks in both years, 1 June to 23 August, Jamie Oliver published 41 long videos this summer against 79 last summer, 48% fewer. Shorts moved the other way, 35 against 29, 21% more. Over the same window, the channel's views per day fell from 176,191 to 151,020, a drop of 14%, so it kept 86% of what it was earning a year before.
The timing lines up: he published a lot less, and the channel earned a bit less. That isn't proof that the smaller output caused the smaller drop. Seasonality moves these numbers, the size of his own back catalogue moves them, and so does whatever YouTube's recommendations were doing that week. Section 2 below is the closest this data gets to explaining why the drop was so much smaller than the cut.
The Takeout: Before you assume more videos means more views, check how much of your channel's daily total already comes from videos you published months or years ago. If it's most of it, a quieter month costs you far less than it feels like it should.
2. Where the views are actually coming from
To see which videos bring in the channel's daily views, I counted every video's views twice, 45.9 hours apart, on 15 and 17 September 2026. The channel gained 467,909 views in that window. Here's where they landed, by the video's age.
| Age of video | Videos | Share of views gained |
|---|---|---|
| Published in the last 30 days | 39 | 35.6% |
| 31 to 90 days old | 51 | 4.0% |
| 91 to 365 days old | 311 | 10.5% |
| 1 to 3 years old | 489 | 13.0% |
| More than 3 years old | 1,957 | 36.9% |
49.9% of the views the channel gained in that window went to videos more than a year old, and 36.9% went to videos more than three years old. Videos under 90 days old brought in 39.6%, and two brand-new long videos alone took 16.8% on their own, so one big upload can move this a lot in a single 46-hour window. That's the reason his summer output cut didn't cost him more: a large share of what the channel earns on any given day wasn't going to come from that week's upload anyway.
Using vidIQ's view curve for his recent long videos, roughly 20,000 views in a video's first day and 66,000 by its first month, the 38 long videos missing from this summer's schedule would typically have brought in about 2.5 million views in their first month. The channel's actual shortfall over the same period was 2.1 million. The two numbers land close together, which supports the reading that the missing videos explain most of the drop and the rest of the library held steady. This estimate is directional: it moves a lot if you swap the typical video for the average one, because a handful of very large videos pull the average up.
The Takeout: Run this same split on your own channel: how much of this month's views came from something published this month, against something published over a year ago. If your answer is close to Jamie Oliver's, a slower month is a much smaller risk than it feels like, and a faster one buys you less than it looks like.
3. The year before, tripling output added 62%; halving it back cost 14%
In 2025, Jamie Oliver's long-form output very nearly tripled: 292 videos against 106 in 2024, and the typical one got much longer, from 8.1 to 18.8 minutes. Together that took the channel from 22.7 hours of long-form video published in 2024 to 140.7 hours in 2025.
Channel-wide views per day, all formats and the whole back catalogue, rose alongside it. The clearest comparison is each quarter against the same quarter a year earlier, because cooking searches rise before Christmas whatever a channel does. Two single-day drops were removed from this series as data events rather than audience: the channel's recorded total fell by 6,674,434 on 15 February 2025 and by 887,055 on 10 January 2024, most likely a removed video or a YouTube clean-up rather than a real loss of viewers.
| Quarter | Views/day | Same quarter a year earlier |
|---|---|---|
| 2024 Q2 | 142,830 | — |
| 2024 Q3 | 135,078 | — |
| 2024 Q4 | 154,824 | — |
| 2025 Q1 | ~148,900 | — |
| 2025 Q2 | 154,890 | up 8% |
| 2025 Q3 | 187,741 | up 39% |
| 2025 Q4 | 250,153 | up 62% |
| 2026 Q1 | 182,333 | up 22% |
| 2026 Q2 | 162,086 | up 5% |
| 1 Jul–23 Aug 2026 | 155,504 | see note |
Daily views peaked 62% above the year before in the fourth quarter of 2025, the same quarter his tripled output was fully live. Measured on exactly the same eleven weeks as section 1, output then fell 48% and daily views fell 14%. So tripling the work bought a 62% peak, and cutting it back to roughly a third of that peak level cost 14%. That's not a straight line, and it isn't proof that output drives views on its own: the back catalogue was also bigger by 2026 than it was going into 2025, Christmas cooking searches lift every winter quarter regardless of upload count, and YouTube's own recommendations changed in ways this data can't see. The last row of the table above isn't compared against a year earlier here, because that comparison is already made properly in section 1 using matched dates.
The Takeout: If you're weighing up a big push in output, look at what happened the last time your own output changed a lot, in either direction, and compare the same weeks a year apart rather than the weeks either side of the change. Seasonal categories move on the calendar as much as they move on effort.
4. What the channel sells, and the cheap fix it's missing
Jamie Oliver's channel page asks visitors to pre-order his new book, 20 Minute Meals, through a link that lands on an Amazon UK store page carrying YouTube tracking tags. That's the one thing the channel page itself is selling.
None of the 254 long videos he published in the 12 months to the pull names that book. Fifteen of those videos mention one of his earlier books, six different titles between them, and two of those link to Eat Yourself Healthy on Amazon. 241 of the 254 carry the same untracked line, "For more recipes - http://jamieoliver.com", pointing to the general homepage rather than to anything in the video, with no way to trace a click back to the video that sent it. The homepage itself does sell the book: on 21 September 2026 its main panel said “It’s Finally Here! My New Book, 20 Minute Meals!” with a Buy Now button, and the site’s recipe pages carry display advertising, so every visit is worth something whether or not it ends in a sale. What the untracked link costs him is knowing which video produced the visit.
There’s a second cost, and it’s the one a business owner feels. A viewer who follows that link lands on a page built to earn advertising money. A recipe page loaded on 21 September 2026 pulled in 24 separate advertising services, put three ad units on the page and five fixed or floating panels, including a sign-up bar, over a page more than 7,000 pixels long. The book his channel page is selling appears further down. The advertising pays for the site, so this is a deliberate trade, and from outside there’s no way to measure what it costs in book sales. What can be said plainly is that the viewer meets several things asking for attention before the one thing the channel page says it wants them to buy.
Only 9 uploads name the new book at all, and every one of them is a Short. YouTube doesn't allow a clickable description link on a Short, on any channel, so those 9 can't send a viewer anywhere by the link alone. Five of the nine use a book link tagged as coming from Instagram direct messages, so any sale those five produced would be credited to Instagram, not to YouTube, whatever actually sent the viewer there.
His latest long video, Quick Protein Packed Breakfast Idea, published 18 September 2026, had 74,229 views when checked on 21 September. It carries two links: one to subscribe, one to the homepage. The homepage leads to the book, but neither link is tracked and neither names the book, so the video can’t be credited for a visit, an advertising impression or a sale.
None of this is a sign the channel is badly run. It's kept its audience through five changes of direction over seventeen years, it doesn't lean on a celebrity label to do it, and long videos alone earned 77.4% of the views on the videos it published in the last 12 months that are old enough to count. What it's missing sits in the smallest, cheapest part of the whole operation: a line of text under each video, and where that line points. Adding a tracked link and naming the book in a handful of long-video descriptions is a five-minute change per upload, not a rebuild.
The Takeout: Open your last ten long videos and check two things: does the description name what you're actually selling, and does the link that sells it carry a tag that tells you it came from that video. If the answer to either is no, that's the cheapest fix available to you this week.
5. Five changes of direction in seventeen years
The channel's title-word mix marks out six clear eras. Each card counts the long-form uploads published in that period.
Each shift shows up in the titles at the exact boundary. Moving out of the guest-presenter era, other-presenter titles fall from 30% to 19% and "Jamie" rises from 41% to 69%. Going into lockdown, "Keep Cooking" jumps from 0% to 24% of titles in one half-year, and it falls back to 0% the moment the series ends, replaced by "Megamix" at 21%. The biggest jump of all sits at the start of the current era: "Ideas" goes from 2% to 22% of titles and typical length nearly triples, from 8.7 to 20.3 minutes, in a single half-year.
Brand deals didn't disappear between the third era and now. They moved. Sponsor tags in long-form titles fell from 18% (2017 to mid-2021) to 0% since January 2025, but in the last 12 months 70 of his 145 Shorts carry an ad disclosure against 7 of his 254 long videos, all of those in the description rather than the title.
The Takeout: When your channel needs to change subject, look at what carried over each time Jamie Oliver's did: the presenter, the food category, or the audience relationship. His changes kept one of those constant every time, and that's worth checking before you change everything on your own channel at once.
6. The title that's worked since 2013, and where it overlaps with length
Every long video is compared only with the long videos published in the same six months, and only once it's at least 90 days old, so newer periods don't get penalised and older ones don't get a free head start. 2,220 of the channel's 2,268 long videos qualify.
Titles promising a number of recipes, like "10 Recipes To Cook This June", get 1.44 times his typical long video, and 65% of them beat it. That holds in every half-year since January 2025 and in every calendar year since 2013 with at least five such titles, though not in every single half-year measured across the whole library: the first half of 2019 came in below typical. 51 of the recipe-count videos published since January 2025 also run 40 minutes or longer, so this pattern overlaps with length, and the 40-minute-plus cut on its own isn't consistent either, at 1.63x overall but only 0.95x in the second half of 2025. Neither figure on its own separates whether it's the promise in the title or the length of the video doing the work.
Christmas-titled long videos get 0.69 times his typical video, and they stay below it even measured only against his other November and December uploads, at 0.69x against 1.03x for everything else published in those two months. Videos tagged as an ad or sponsored get 0.66 times typical. That's a correlation rather than a verdict on sponsorship: a sponsor picks the topic, and it may be one his audience wanted less than the ones he'd have chosen himself.
The Takeout: If a title format works for you, check whether it's really the words doing it or something that travels alongside them, like length or timing. Jamie Oliver's recipe-count titles and his longest videos overlap so heavily that his own data can't fully separate the two, and yours might have the same blind spot.
Put simply
Jamie Oliver cut his long-form output nearly in half this summer and lost far less in daily views, because most of what the channel earns on any given day comes from videos published months or years before. The year he tripled his output, his views rose a lot more than they fell when he cut it back, which points at diminishing returns on extra volume rather than a straight line between the two.
The channel's changed subject six times without losing its audience, and a short title promising a number of recipes has worked since 2013. None of that shows up anywhere near his own book. The fix for that isn't a new content strategy. It's naming the product and tagging the link, in the description of the videos he's already making.
Method and limitsSources, dates, definitions and what this can't see
Public data only. The full library of 2,876 videos was pulled from the YouTube API on 15 September 2026 and re-derived on 17 September. A second full pull on 17 September, 45.9 hours after the first, is the basis for the view-age split in section 2. The channel's most recent long video and its description links were checked live on 21 September 2026.
31 livestreams were identified from their broadcast windows and held out of every sample and baseline, along with 111 pre-Shorts clips (videos of 62 seconds or less published before the Shorts format existed on 14 September 2020). YouTube's public data carries no Shorts flag, so format is assigned by length: 62 seconds or less before 15 October 2024, and 182 seconds or less after it, when YouTube raised the Shorts limit.
Each long-form video in sections 3 and 6 is scored against the median of the long-form videos published in the same calendar half-year, and only videos at least 90 days old are scored, so newer periods aren't penalised for having had less time to collect views. 2,220 of 2,268 long-form uploads qualify. The six eras in section 5 are calendar blocks set at the point where the mix of words in the titles changes.
YouTube changed how it counts a view on 24 August 2026: a public view now counts from the first frame, with no minimum watch time, where it previously counted only after an undisclosed threshold. Every video scored in sections 3 and 6 was published, and every quarter in the section 3 table ends, before that date. The 45.9-hour count in section 2 was taken entirely after it, on both sides, so the two counts in that comparison are measured the same way as each other, even though they aren't on the same basis as the older figures elsewhere in this article. No single uplift multiplier is used anywhere in this article, and no post-boundary rise is presented as growth.
The book-link figures in section 4 cover the descriptions of the 254 long videos and 145 Shorts published in the 12 months to the pull, with every shortener followed to its final address. "Untracked" means the destination URL carries no campaign tag; whoever owns a given shortener can still see click counts on it, which this analysis can't.
A paid-traffic screen was run on the channel's most-viewed videos, comparing each one's like rate and comment rate against the long-form norms of its own half-year. None of the top ten long-form videos looked bought by that test, and all ten are brand-carried: at 6.21 million subscribers, none of them has more than 5 views per subscriber, so none is evidence that the same recipe would travel this far for a smaller channel.
There's no Studio access here, so nothing in this article estimates impressions, click-through, retention, traffic sources or revenue, and nothing claims that a change in output caused a change in views. Where a cause is suggested, it's labelled as an interpretation, and public data can't settle it either way.
Analysis and write-up: Stewart Read.

Meet Stewart
Stewart Read
YouTube Growth Strategist
Stewart has run YouTube channel management for 8-figure businesses - turning channels into reliable sources of leads, clients, and measurable revenue, not just views.
Using a class-leading suite of channel analysis tools he built himself, he pinpoints exactly what makes your audience click, watch, and convert - then turns those findings into videos that bring buyers to your business.
Channel Intelligence
The monthly service behind this analysis. A written briefing on what your channel returned to the business, a video walkthrough of the findings recorded by Stewart personally, and a plan for the videos to make next.
See how Channel Intelligence works